Thermal comfort analysis of an office is not much different from simulating the ventilation system of a car park. What puts these analyses into a different perspective is the need for determining occupant comfort. Cars do not complain about draught and cold feet, do they? A comfort analysis is especially important if the office floor takes many occupants. I have seen layouts where hundreds of people sit side by side for the whole day. Obviously their comfort is of top priority to the employer. In this case study we do not go that far in terms of occupant numbers though. The layout was inspired by a small engineering office I used to work in many years ago.
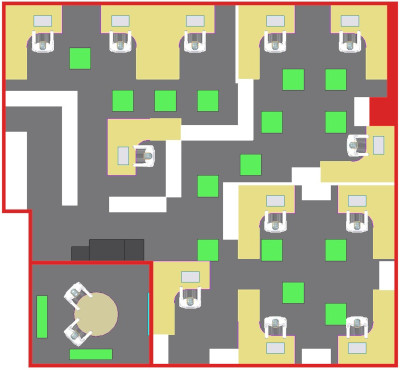
Layout of an engineering office
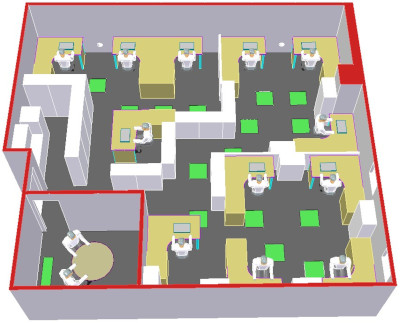
This office has 12 workstations plus a small meeting room and a kitchenette on the left because no company runs without coffee. Every person has their nice and big L-shaped desks with storage and a laptop on it. The kitchenette is separated by 6ft tall cabinets from the rest of the space. Other than that the office only has short storage cabinets so it fits the modern open space concept.
Heat sources in the office
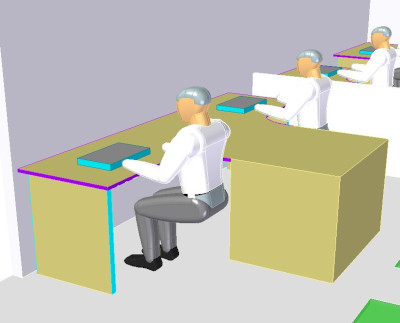
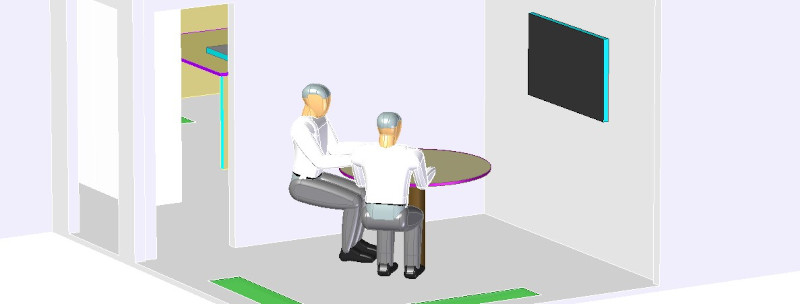
In this example each engineer has a laptop on their desks which generate a certain amount of heat when switched on. Heat gain of laptops is 40W each which we define as a surface heat source. In the meeting room is a large screen on the wall that generates 100W heat, again defined as a load distributed on the TV’s surface.
(room walls removed for clarity)
The human body also generates heat for which we use 60W per occupant in the simulation. There are very detailed human body comfort models available in our CFD software that can work with different age, gender and clothing. Those are great for car or aircraft cabin ventilation simulations.
In this case however we wanted to keep the setup simple and so used the human body model as a single volumetric heat source. The reason for our one volume approach is that the detailed model would be a bit of an overkill for an office with 400 occupants when clients even accept simple blocks to represent a human.
So far we have 14 occupants including the two people in the meeting room, 12 laptops and a TV with altogether 1420W heat generated. Additionally there are light sources in the ceiling with 8W/m2 heat gain, which adds 46W to the above sum. This means the ventilation system has a constant 1466W heat input to deal with.
Ventilation concept
The ventilation concept of this particular engineering office is similar to those used in data centres. Fresh air is supplied via 60 x 60cm grilles which distribute air from the pressurised floor void. These grilles have green colour in the model for easy recognition. We organise these grilles to be near the workstations but still tried to keep them away from the occupant.
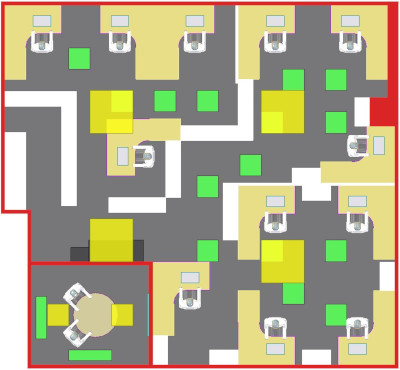
Used air is extracted at high level, again via grilles that are organised in islands of four. The above figure on the right shows these extraction grilles in yellow. There are two 30x120cm fresh air supply vents (also in green) in the meeting area together with two 60×60 extraction grilles to make sure there is sufficient air supply in that part of the office. Similarly to the floor void, there is an air volume above the ceiling from where used air is extracted.
Determining fresh air supply
In the UK there are regulations that determine the necessary minimum number of air changes in an hour (ACH) in a room. It depends on the purpose of the room but for an office like this the requirement is 6-10 ACH. The room in our case has 105m2 floor area not counting furniture. Room height is 2.5m which gives 262.5m3 air volume. This needs changing 6-10 times in every hour. We go for 10ACH, so the flow rate of the fresh air supply is 2625m3/h. Some may say pushing in the required air flow rate will satisfy the regulations and the job is done. But again, people will complain if they are too cold or hot, or have to sit in the draught all day. This simulation is about determining thermal comfort so that both regulations and human needs are satisfied.
Analysing ventilation efficiency and occupant comfort
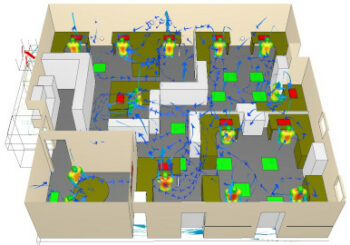
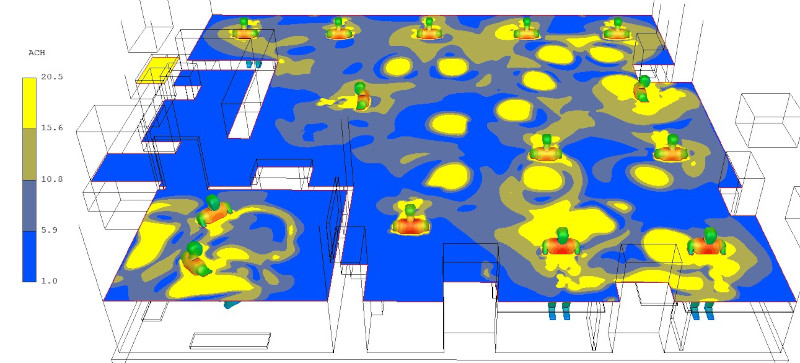
The fact that the room has a fresh air supply of 10ACH may not mean that 10ACH is at present in every part of the office. The figure below shows the ACH map in the room at chest height of the sitting occupants. Blue colour represents areas of 6ACH and below, which is not enough. Grey coloured areas are in the optimum range, but yellows mean that local ACH is at or above 15.6ACH, which is too much for an office. According to the ACH results, the ventilation system could benefit from a better arrangement of floor grilles. The kitchenette and nearby area are full blue so it is worth installing some air inlets there. More and smaller fresh air vents would be my next step in the design process to run an analysis on.
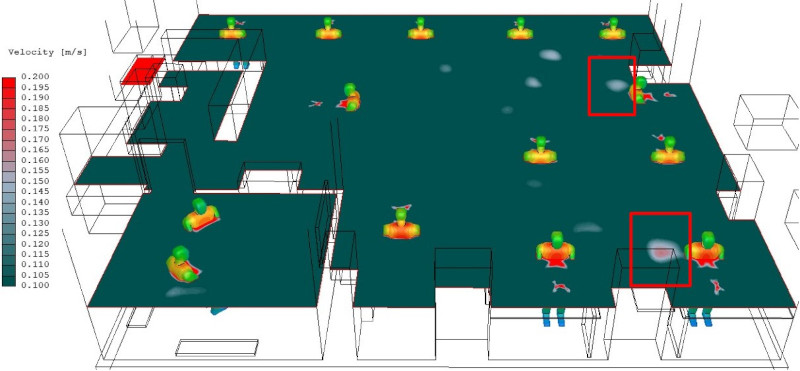
Air velocity can add some more insight as well. The figure below shows, again at chest height of a sitting person, local air velocity in the range of 0.1 – 0.2m/s. Everything green is below 0.1m/s which is an important value because that is the limit where humans start feeling draught. From this point of view most of the office is fine except workstations at mid right and in the lower right corner as framed in red in the figure below. This would also emphasize the need for rearranging floor vents in that area.
Body temperature in office thermal comfort analysis
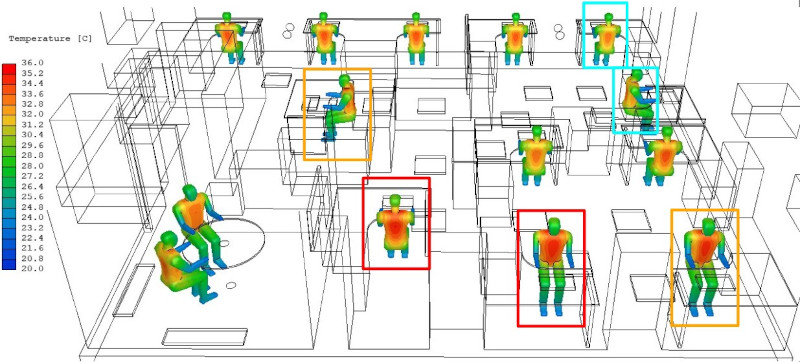
Besides determining local ACH and air flow velocity in any point of the room we can analyse occupant comfort in terms of body temperature as well. Average temperature of the 14 bodies according to the thermal comfort simulation is 31°C. Most of the occupants’ body temperature are very close to this average but there are a few workstations that do not give the same comfort.
For example in two locations, these are framed in blue, body temperatures are 30.7°C which means high chance these people will feel colder than the rest. On the other hand positions framed in red are the ones that suggest the highest occupant body temperature as their average is 31.5°C. The two locations in orange frames have 31.3°C averages so these also need some attention.
Different parameters calculated in a thermal comfort analysis like local velocity that indicate draught and occupant body temperature that could show cold or warm air streams at present will give additional information on the effective design of a room ventilation. These variables together with local air changes per hour numbers could provide guideance as to what the designer needs to focus on to specify a system that not only fulfils requirements but also provide a comfortable environment.
Contact us regarding your thermal comfort analysis needs here.
Dr Robert Dul