Challenging to imagine now, looking at the horizontal rain outside, that solar heating and wind cooling simulations will ever be relevant in London. But the truth is that weather and comfort simulation together with shading design are all important aspects of modern urban planning. In countries with warmer climate than the UK, it is essential to include surface temperature of structures in the design parameters. And much sooner than we hope, it will be essential in some parts of the UK as well. In this study we use a steel canopy structure placed in the London and Dubai summer to compare the effects of different climates. We show how the shape of canopy influences surface temperatures and what may be good for London will certainly not do in Dubai.
It was already 40ºC hot in London in 2022
2022 was the UK’s hottest year on record. The tendency is worrying because for example outdoor heat exchanger plants are designed to work without loss of cooling performance up to 36ºC. It is also a fact that surface temperature of regular industrial machinery cannot exceed 60ºC to be safe for the people operating them. But what about an open air steel shade structure that will be standing in the already 40ºC air, under the blazing June sun? Will the structure be safe to touch?
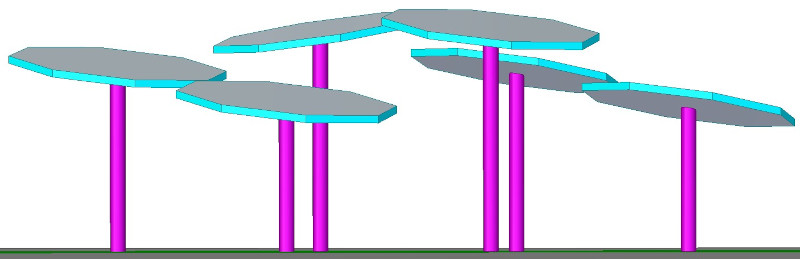
Shades in a park
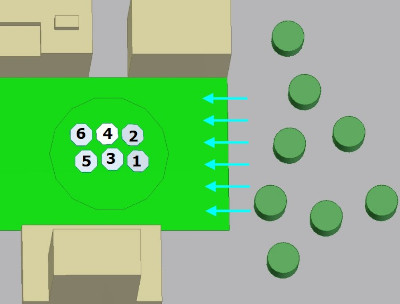
The model I made for the solar heating simulation uses six steel columns of three different heights. The columns are 4m, 5m and 6m tall and there are two canopies of each height arranged in a way that the tallest ones are in the middle. All shades are the same octagons (with 8 sides) that fit in a 6m diameter circle. All shades are tilted 10º and depending on the way I arranged them, some of these face either a different or the same direction. My intention was to maximise size of cast shadow every hour of the day.
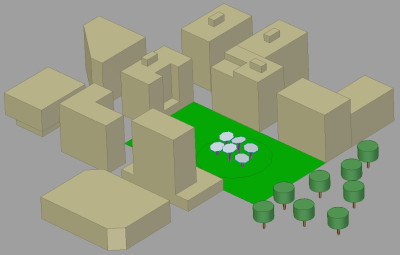
The aim was to model a small urban landscape with buildings of different shape and size with some trees, like a small park in a city, a university campus or a technology park.
I wanted something general that could be almost anywhere in the world. So that a variety of ground types, building materials and solar orientations would make sense on the same model.
The ambient air volume has to be huge
The simulation geometry had to be much larger than the area all buildings and the park took. There was a 300m diameter 5m thick slab I used to position the buildings and the park on. Then I put the whole model in a 700m x 700m x 120m (L x W x H) air volume so that I could simulate wind.
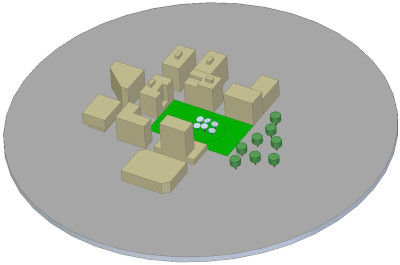
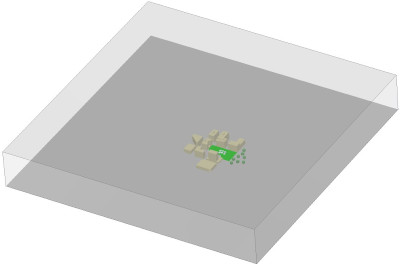
The box shaped ambient air would make the simulation of four wind directions quite easy. This is possible because the mesh could be the same. We only need to swap the inlet – outlet and slip surfaces to make a direction change.
Some references use a hexagon (6-sided) air volume where three sides are inlets, the other three are outlets. I think this is a great way to make the ambient volume fit for several wind directions. But I would be cautious about using a boundary condition system where a flux (velocity) and a pressure (outlet) condition is in direct contact along a line. This may cause instabilities in the simulation.
Urban aerodynamics simulation used as initial condition
The interaction of solar heating and wind cooling simulation required the boundary conditions of an urban aerodynamic simulation combined with the parameters of solar radiation.
Since the solar radiation parameters are time dependent (the sun is moving across the sky during the day) I decided to run the urban aerodynamics alone as a steady-state first. Then I used this to initialise the flow field of the solar radiation part of the project.
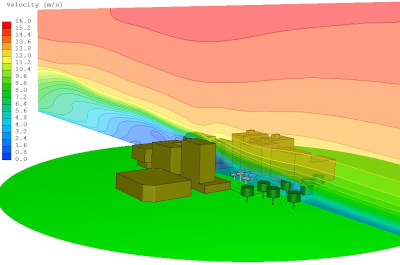
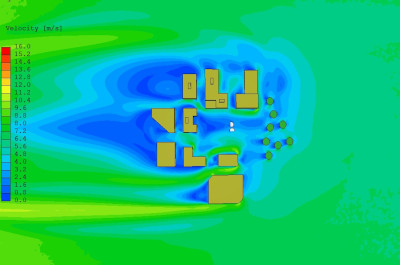
I picked a fairly common 10m/s at 10m height wind speed for the London area from a historical weather database. Using this I calculated the logarithmic wind profile and applied that in a way that wind came from the side where all the trees were.
Location and daily air temperature make a difference
Once the first CFD simulation calculated the wind velocity profile, it was time to define what made this model a small urban area in London or in Dubai.
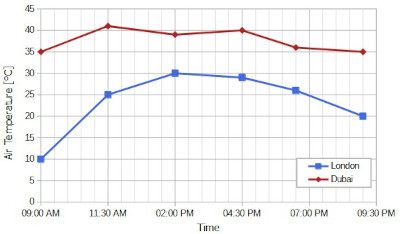
For this example I chose the time period between 9:00am and 5:00pm. But any part of this graph can be used during a simulation.
Also, this graph can span over several days. Hence daily cyclic temperature change of solid objects, like buildings and the ground can be modelled.
Since I already had the initialised flow field from the steady-state simulation, all I needed was to add the time dependent temperatures to the wind inlet boundary condition and continue with the transient solar radiation part of the project.
The other parameter sets were the location and solar radiation values specific to the place. Location was easy, it only needed the coordinates. I could also set the orientation of the CFD model by telling the angle between the coordinate system and true North. It took a few more moments to find out what longitude of standard time was. Luckily I found a map that showed the time zones both in hours and in degrees. The CFD software needed the degree (60 for Dubai), not the hour (+4 hours from GMT).
Location and season specific solar load parameters
Solar radiation parameters could get tricky though. Solar constant is straightforward because it is the amount of radiative energy emitted by the Sun, before it reaches Earth’s atmosphere. The CFD code uses the 1330W/m2 solar energy constant and other parameters (atmospheric transmissivity and the monthly constant for the same) to calculate direct solar radiation, sky solar radiation and reflective radiation for the given date.
The atmospheric transmissivity is location and season specific. It tells how transparent the atmosphere is. It tends to be lower during the summer (in the range of 0.6 – 0.7) and higher during the winter (0.78 – 0.8). I picked 0.7 for both supposing clean air, but a sand storm in Dubai can reduce this a lot. As we were aiming for a worst case scenario in terms of surface temperature, clean air would mean more direct sun radiation reached the solid objects.
Everything else the software used to calculate the Sun’s position came from the chosen date of the simulation: 22nd June 2023.
Solar heating and wind cooling
The solar heating and wind cooling simulation spanned the time of 9am to 5pm. As the sun rises and moves across the sky, the solar energy reaching all solid surfaces changes with it.
from 9am to 5pm on 23rd June
The animation above shows the important aspects of designing for solar heat load. The first is that material, colour and temperature of the object matter, especially in Dubai. Canopies are made of steel which if not polished and painted a bright colour, can emit large amount of energy. This is due to high emissivity of 0.9 in our case. Buildings in this example are made of brick, which has a rough and darkish coloured surface as well (0.88 emissivity). So again can emit large amount of energy.
These objects are also not transparent. They either reflect or absorb solar energy, they do not transmit any. Reflection is challenging with a dark and rough surface. The steel canopy has 0.9 absorption coefficient, while the buildings have 0.75. So most of the energy will be used to heat the solid objects.
The other important aspect is the shape and orientation of the canopy. While in London from noon to 2pm our canopies could cast some shadows, in Dubai however these shadows barely extended beyond the base area of the canopy array and basically not moved in these two hours. This was because the sun was very high in the sky for quite long.
Same applies to the buildings. In London shadows of buildings were quite long, could cover areas among the buildings for most of the simulated time. In Dubai however, between 11:30am and 1pm shadows of buildings covered only a very small area.
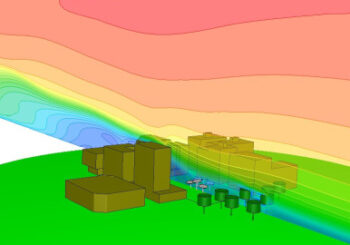
Wind can make it better and worse
In our analysis wind is an important factor as well. It can help or worsen the situation. Wind can either take the absorbed energy or can add more heat with convection. This is what the next graphs show.
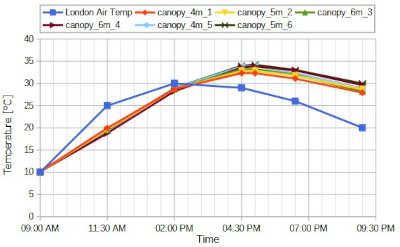
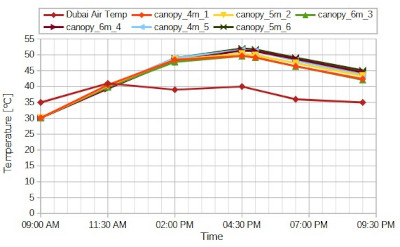
In London, till 2:30pm ambient air got warmer faster than the surface temperature of the canopies. Hence before this time wind added heat to the canopies, while after 2:30pm, wind started to cool the metal structure. In Dubai the warmer wind period only lasted till 11:30am. But the colder air, which was still above 35ºC, was unable to keep the canopy surface temperatures at bay.
In Dubai however, the same canopy could reach 52ºC by 4:30pm.
In Dubai canopy surface temperatures exceeded 45ºC by 1pm and stayed above that for 7 hours.
The reason for canopy 6. having the highest temperature was that its South-facing shade collected a lot of heat. But it was also in the wake of other canopies, not receiving enough wind cooling.
Climate specific urban design is key
Solar heating simulations taking the effect of wind into account enable designers of the urban environment to create spaces specific to local weather. Besides wind speed and direction, material, smoothness and colour of the surface are all defining factors, and not just for canopies. Have you seen images of The Line in Saudi Arabia wondering why it looks like a giant mirror? Because they know that climate specific design is key to a liveable urban future.
Dr Robert Dul