When doing CFD simulations of industrial machinery, sometimes a furnace or a casting machine smoke extraction system never come to life due to changes in project budget or focus. Unfortunately in these cases you cannot get feedback about the accuracy of the CFD results as you have no measured data to compare with. For building elements like louvres, this is rarely the case. Especially if the louvre is small enough so it gets easily built and sent to physical prototype tests. Advanced Ventilation Systems (AVS) was keen to test their product and our louvre pressure drop CFD simulation capabilities and wanted to compare simulated and measured pressure drop results. The louvre was a bit different and smaller from the usual 1m x 1m standard geometry as this one had only 3 blades.
It started as a nice challenge (just like this louvre performance project) I was happy to take on but turned out to be a crusade I was even happier to go through. Here is why and how.
The original geometry
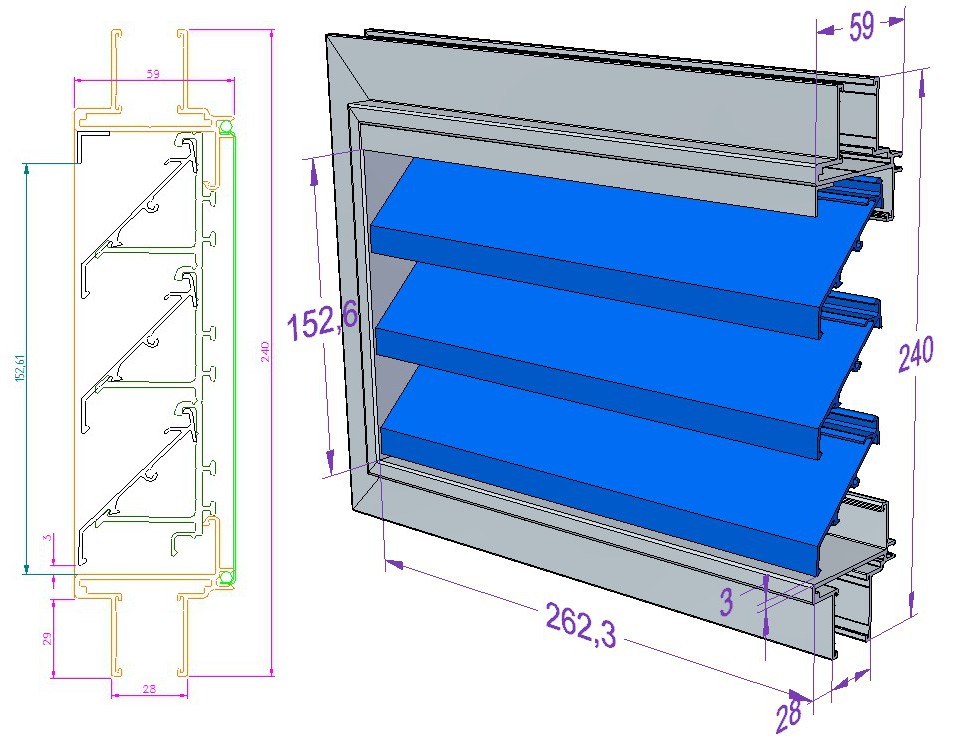
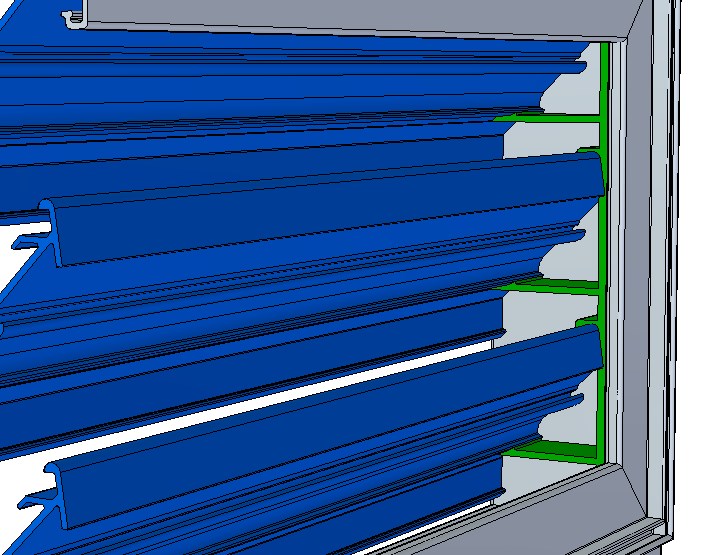
are 481.2mm x 121.2mm. Also the clip part that holds the blade in place (shown green on the 2D drawing above) and should bea the vertical frame is not part of the 3D model. At this point it was for a reason.
[/one-third]
It worked for all other louvre CFD simulations
According to my experience with other standard size 1m x 1m louvre geometries I could reach 95% accuracy of pressure drop compared with catalogue data even if these were not part of the model.
Starting from scratch I needed 90 minutes to build the 3D louvre geometry and put it into my standard measuring rig model. The rig model represents the equipment companies like BSRIA use for the physical prototype tests. Therefore I use the same rig 3D model for all my louvre simulations so I know exactly how many elements it takes to mesh it, where to place the boundary conditions and so on. As a result it really does work as a standardised test device in the CFD software tool.
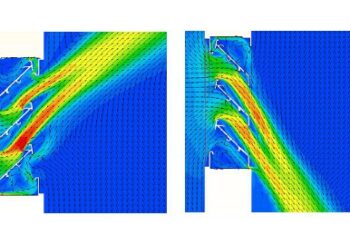
AVS wanted to run the model with a single flow rate of Q=324m3/h which gave v=1.125m/s louvre face velocity on the entry side. The images below show velocity profiles with magnitude and flow direction both for entry and for discharge setups.
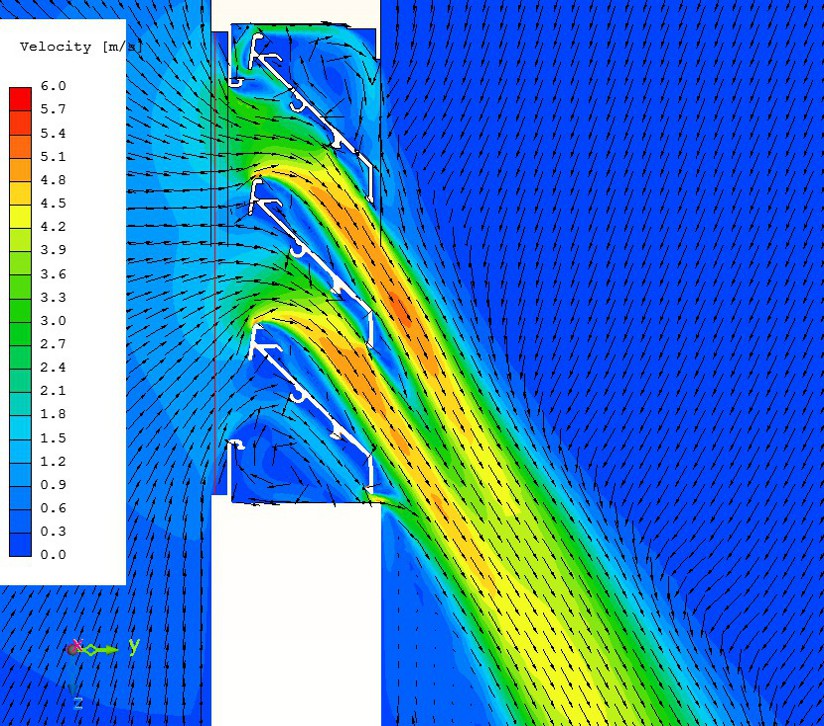
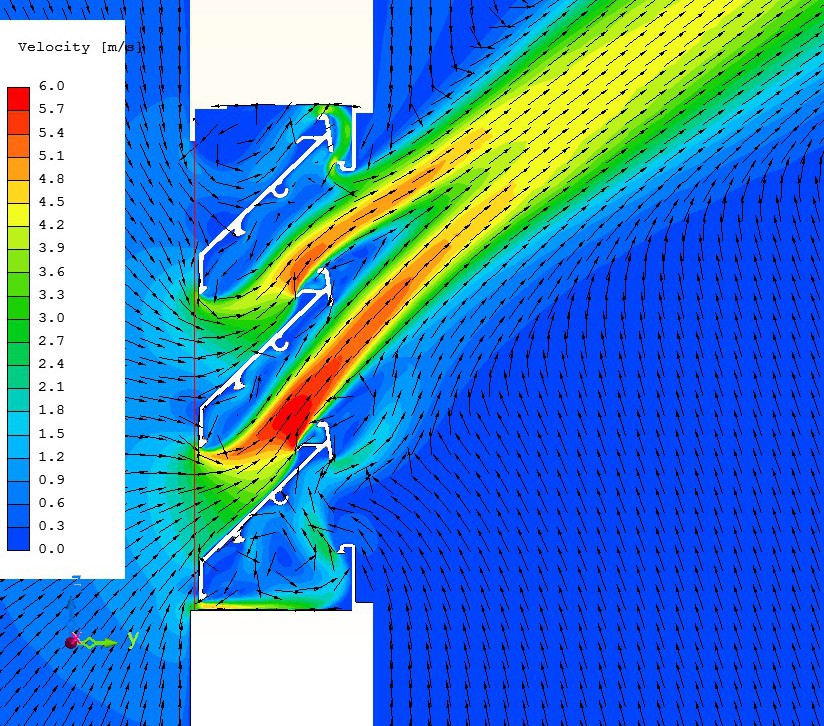
In physical prototype tests BSRIA measures pressure drop 100mm behind the louvre, which was exactly what I did. I averaged the pressure on a cutplane 100mm behind the louvre and got these:
- Entry setup pressure drop: Δpe=17.76Pa
- Discharge setup pressure drop: Δpd=14.73Pa
I prepared the report and sent it to AVS a few days before the physical test was ready. And kept waiting.
In a few days time AVS sent me the BSRIA report saying:
- Entry setup pressure drop: Δpe=19.8Pa
- Discharge setup pressure drop: Δpd=19.5Pa
The simulated entry setup result was sort of acceptable (“not great not terrible”) but the discharge result was way off. What happened? I had to investigate that.
How to troubleshoot a louvre CFD simulation?
At university I was taught the standard method of running a simulation project:
- get measured data if you can (I couldn’t, the point was to test how close I can be without knowing measured results),
- choose a bunch of turbulence models (bearing mesh requirements of that specific turbulence model in mind) to see which gives the closest results,
- create three meshes with different resolution: coarse, good and fine and check if results are sensitive to resolution changes.
I did this fault finding the other way round. I used the same mesh and run a set of turbulence models on it (those that fitted the mesh, a mesh for k-E it not okay for k-w!). This was the fastest way of making sure the settings and turbulence model I usually use (and derived based upon the classical university method above) did not go sideways for some funny reason. Here are the results:
It was not the turbulence model as no significant change was produced especially for the discharge setup. As a consequence I did not spend time trying k-w as that would have needed a new mesh anyway.
Next level is geometry
Not the level of change that I would have blamed for the results being off. So I kept on digging deeper and consulted AVS and came up with two more differences in the geometry. AVS told me that the 3mm gap below the bottom blade could be 4mm depending on how they set the blade holder clip. The other one I found in the BSRIA report which together with the larger gap might have had more influence.
BSRIA report shedding some light
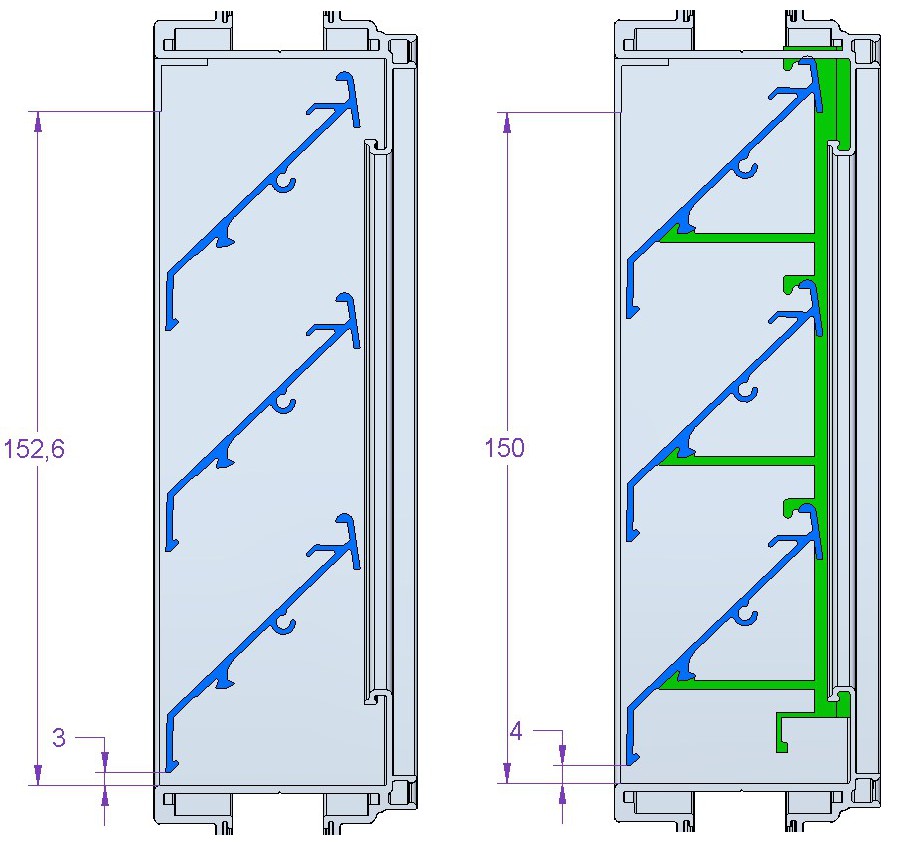
On the far left is the original I started the project with. Without the green blade clips, with 3mm gap size and 152.6mm high louvre face opening. On the left is the one that is representing all updates. The green blade holder clip, the 4mm gap at the bottom blade and the 150mm louvre face height which eliminated the gap above the top blade are all in place. So I went on and ran the simulation again, using the original settings.
It was the geometry
Looking at the results I knew we were winning because the updated model showed a 15% pressure drop increase compared with the original louvre.
At this point I thought it was time for the mesh sensitivity check as geometry changes moved results into the right direction. So I picked up the old recipe and created two more meshes of the updated geometry. The original mesh had a base element size of 32mm, so I made one with 36mm and an other one with 24mm. Please note that in my CFD code base element size means the largest element in the mesh. There are much smaller size elements in the mesh around the blades than that.
Anyway, the results for entry and discharge setups are:
As the difference between the results of the original mesh of 32mm base size and the fine one is 1%, it is safe to say that the original 32mm base mesh size was good enough.
Pressure losses show what I was suspecting. Meaning that these changes affected the discharge setup more than the entry one. The difference between the original result and the updated model with 24mm base mesh size is 8.3% for entry, but 16.2% for discharge.
Where could the remaining 12% be?
But why discharge setup is still 2.4Pa (12.2%) short? Could be the insect mesh on the discharge side I did not built into the simulation model. Or it could be the size of measuring rig (BSRIA report showed a much smaller box than I used). Could be location of pressure measurement, or something else.
AVS was happy with the results because it showed the louvre would be below the required maximum pressure drop and because of the thorough investigation. We agreed that even the smallest details mattered.
As you can see, even a standard louvre CFD simulation challenge could turn into a crusade. Because I wanted to know why it was so. If I faced a similar situation again, I would be happy to go on the next crusade. Because I would surely learn something. This is the way.
Dr Robert Dul