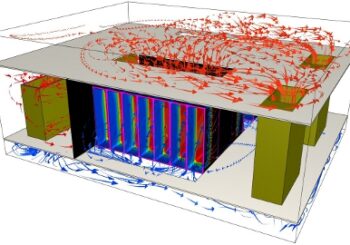
Data centres are serving almost every aspect of our lives. No social media or online meeting without them. As some refurbished industrial units house computing facilities instead of say machine shops it even affects the building industry. But jamming racks and coolers into a building that was not designed from the ground up for this has risks. These risks can expand to the external environment of the building. Micro-climate of a densely build area can adversely effect the operation of the data center outdoor cooling plant. A data centre CFD simulation reveals the limits of the ventilation system and is able to predict hot spots and unbalanced operation of cooling units.
Data centre CFD simulation components: racks and CRAHs
Even without modelling each server in a 42 or 47 unit high rack the CAD model of the data hall can be massive. I had projects using 60 racks which was all right, but had one with more than 200 racks. The latter one almost doubled the element number of my previous record largest mesh of 74million.
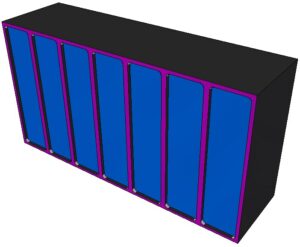
A blue volume represents the stack of servers on which we define heat load and air flow rate. We have never modelled each server individually as exact type of server is unknown at this stage of the design process. As for the racks we only need the heat load these are producing. We can calculate the rest from other design data.
Computer Room Air Handling units (CRAHs) can also be quite simple models while still having the same functions of a real unit.
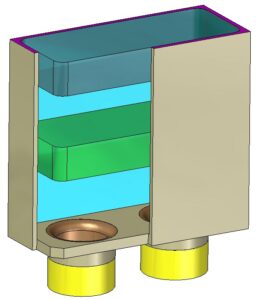
The green block in the middle is a chiller onto which we define cooling performance of the given CRAH. There are several CRAHs in a data hall and each one of them could have different cooling performances.
The last component of the indoor cooler unit is a set of fans. Again, there are several types, some has 3 fans, others have 2 or even only one. These are centrifugal fans in real life and we only model their contour. No fan blades of course, the CFD code takes care of that.
Data hall internal layout
Now that we have racks to generate and CRAHs to remove heat from the data hall air, the question is how to arrange these on the floor.
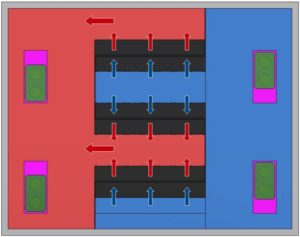
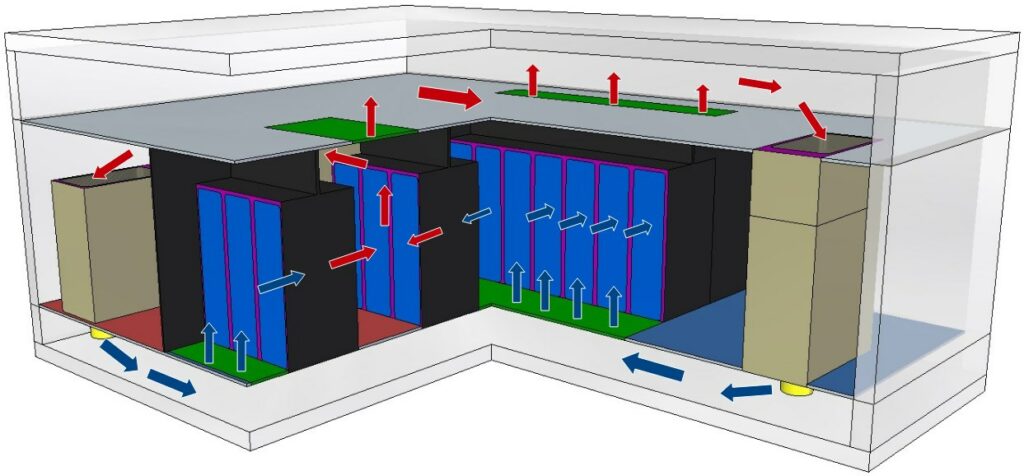
The left figure shows why. Cold air intake (blue area) and hot air exhaust (red area) sides of the racks are sealed from each other. In theory different temperature streams can not mix but in real life there are some leaks we will discuss later. This ventilation strategy increases efficiency tremendously compared with older concepts. But if you look at the example on the left you will notice there are CRAHs in both aisles.
So exactly how are cold and hot aisles separated? And why are CRAHs in both of them?
First of all, there are CRAHs in the cold aisle too as there is not enough space for all four in the hot aisle. When defining how many CRAHs a data hall needs the designer will calculate with redundancy. In case a CRAH shuts down the remaining units have to compensate for the missing cooling performance. There has to be enough excess cooling performance in the system to provide sufficient air recirculation in case of emergencies.
There are two CRAHs in the cold aisle (blue floor area). This is only possible because their hot air inlets extend into the ceiling void. Egg crate grilles (the flat green parts in the ceiling above the exhaust side of racks) connect this space to the hot aisle. There are egg crate grilles above hot sides of all three rack rows.
Some of the hot air rises into the ceiling void to go to the CRAHs in the cold aisle, some part stays in the hot aisle which travels into two CRAHs in the red floor area.
All four CRAHs supply cold air into the 600mm high floor void. In reality this void is made by building a raised floor above the slab. 100s of coloums support the raised floor which we never model in CFD. In front of the cold air intake side of racks floor grilles replace the otherwise solid floor tiles. Floor grilles distribute and guide cold air coming from the floor void. They create a quite high speed (1.3 – 1.7 m/s) vertical air flow in front of the racks so that servers in the top tier could get cold air too.
Then air passes through the racks while its temperature rises and the cycle starts again. However, neither the floor nor the ceiling voids are that clean as shown above.
Trays, baskets and beams in the way of air flow
Many data centre CFD simulation projects stop at modelling racks, CRAHs and the building. But reality is a bit more complex. Look at this and compare with the air circulation figure above:
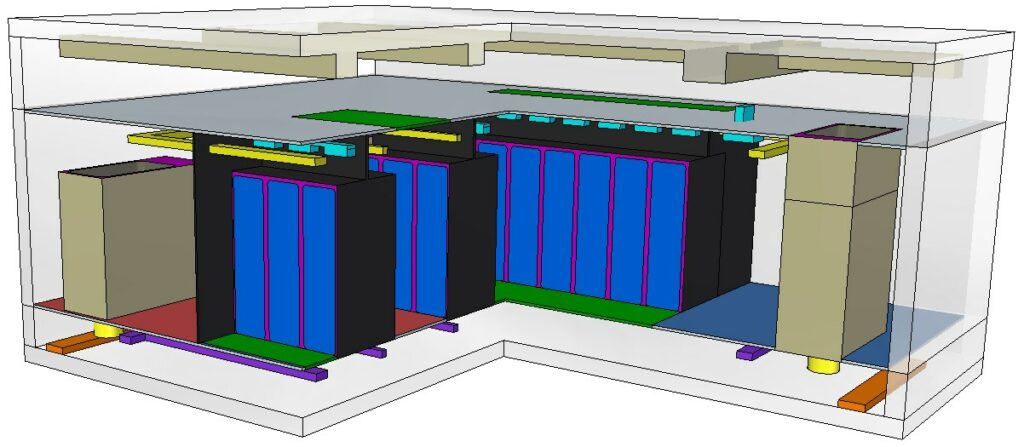
The orange part in the floor void is an AC-tray that supplies electricity to CRAHs from the uninterruptible power supply (UPS) room. Laid on the slab in multiple layers on top of each other these trays come in different widths and usually are 50mm high.
The purple part still in the floor void is the wire basket that takes earth and fire alarm cables. These may be laid on the slab further raising the pile of trays or are hung below the raised floor. Either way these together with the AC tray take up valuable space in the floor void. As such these can be pretty much in the way of smooth air flow.
Hot and cold aisle air volumes are not free from obstructions either. However, these usually do not mean so much interruption to air flow as trays in the floor void.
The yellow part above racks is the data tray. These trays organise fibre cables between racks and switchroom equipment. The cyan parts are databars and these deliver power from the UPS room to servers. There is a databar above the cold side of each rack row. In case there is not enough space above racks due to re-purposing an old building, both data trays and the equivalent of databars in the form of more trays go into the floor void.
Looking back to data centre cooling simulation projects we worked on in the past one more thing was obvious. There were always beams and mechanical service ducts in the ceiling space that further restrict air flow.
When we work on a data centre CFD simulation project, trays, baskets and beams are always part of the data hall model. Our experience tells these features make a big difference in terms of a geometry being realistic or just a demonstration.
Leak, no leak
Some may say that even a geometry with all building specific details are just an exercise if the model does not take air leak between hot and cold aisle into account.
Well, my opinion is that the simulation can be correct without air leaks. But if the client specifies it correctly, we can certainly include air leaks. Where are these leaks in a ventilation system that supposed to seal the hot and cold sides perfectly?
Well, every door between the two aisles leak at the sides and at the floor. Seals above racks leak, usually 5% of the seal surface is an acceptable leak size. And cable connections to the racks leak too. The cable opening to each rack is usually a 200 x 200mm square. 20% of this area is a reasonable leak requirement that creates a short-cut from the floor void to the hot side of the rack.
Thermal specification of the data centre cooling CFD simulation, no leak
The beauty of this kind of simulation is in its simplicity. The purpose is to show hot spots and racks that do not get enough cold air flow. It can also pinpoint those CRAHs that get hotter air than the others. In real life these will have to work at a higher cooling performance thus consuming more energy.
We need these data to specify the simulation:
-
- rack heat load for each rack in kW,
- target cold aisle temperature,
- target hot aisle temperature. Difference between cold and hot aisle temperatures is called dT (delta T) which is a characteristic property of the data hall ventilation system.
We can do a pretty realistic simulation of the data hall from the above and a good detailed CAD model using a few more thermal criteria.
The simulation is based on the thermal and flow balance between hot and cold sides of the ventilation system. This criterion means that CRAHs remove the exact same amount of heat as racks put in and move the exact same amount of air as racks circulate.
How leaks change thermal balance
Apart from the above thermal data, this approach requires the specification of leak sizes and locations. These are usually the ones I wrote about in the previous chapter. In addition to that, this approach utilises the EnergyStar Flow Rate Ratio Curve.
The EnergyStar curve defines air flow rate per rack kW as a function of rack cold air intake temperature. This flow rate however is less than what target dT would require, at least for a usual 25°C cold aisle. Meaning that dT across racks and dT across CRAHs will be different with rack dT higher than the other.
An example. Let’s suppose the difference between target cold and target hot aisles is dT=11.5°C. This defines CRAH cooling performance. However EnergyStar for an 8kW rack at 25°C cold aisle temperature leads to dTr=14.23°C. In plain English: racks pump in more heat than CRAHs can remove.
This would be a one way ticket to simulation divergence, if leaks were not considered. Cold air short circuiting into the hot aisle without crossing the racks is supposed to re-balance thermal behaviour of the data hall.
Obviously the approach of using leaks is more complicated. It further increases project size because leak areas must be meshed too. Sure the concept is closer to reality. And may be useful to look into these details when everything else is well defined in the data hall layout. However, it does not take us further ahead towards the reasonable aim of improving design and space utilisation at the data centre layout at the beginning of the planning process.
Data centre cooling CFD simulation results
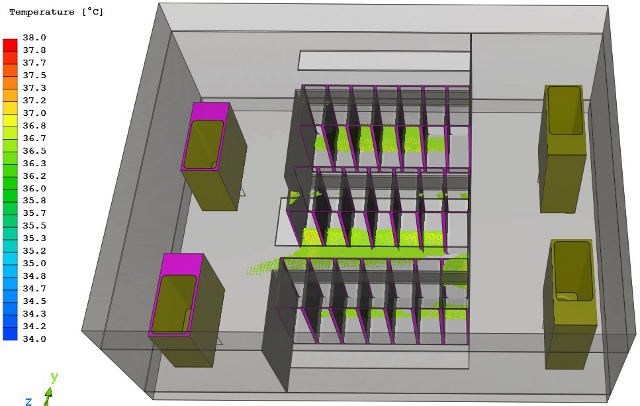
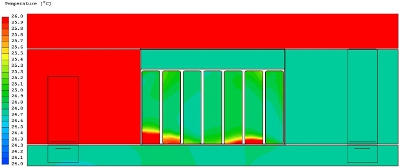
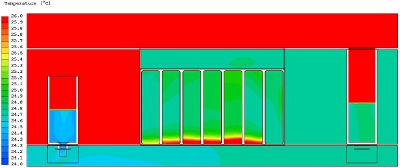
Clients are interested in very well defined features when asking for a data centre CFD simulation. They want to see if any hot spots in the hot aisle exist. Green patches at the bottom of rack rows show where the warmest areas are. The reason is that cold air emerges through floor grilles with quite high speed, so air struggles to take a sudden turn close to floor level. The solution is to raise racks say 100mm above floor level, which designers usually do anyway.
Are any low velocity areas in the hot aisle? Clients usually do not specify what they mean by low air velocity areas so I show them locations where air velocity is between 0.05m/s and 0.1m/s. The upper limit of the range is the lowest air speed a human can feel as draught. Designers use this air speed in ventilation design so 0.1m/s provides a good indication where to improve, in case air velocity needs some increase.
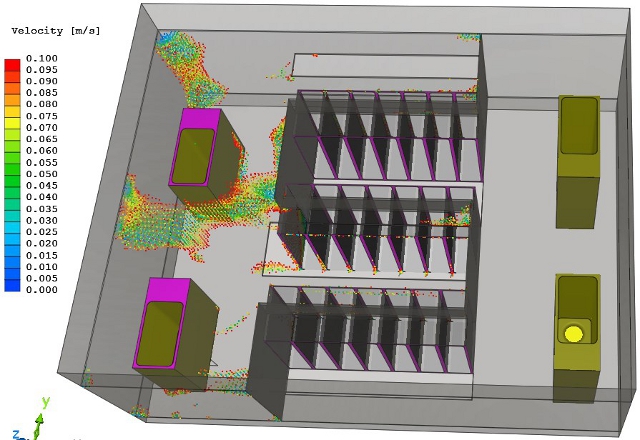
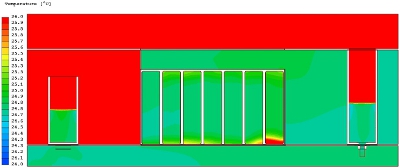
This is in line with the hot spots, again showing that lower levels of the rack tend to get slightly higher temperature air than servers at mid height.
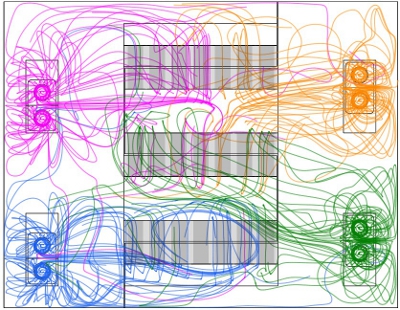
Analysis of a failure scenario is a key point in every data centre CFD simulation. Knowing which CRAH supplies which part of the rack row will indicate where we can expect increased server temperatures. Moreover, it can indicate which CRAH can efficiently take over the supplied area of the broken down cooler unit.
Simulating control strategy of the data centre
Sometimes the most notorious clients ask about simulating the planned control strategy of the data hall. Control strategy means how a couple of temperature sensors control the cooling water flow rate through a set of CRAHs. In my last job when this came up, 17Nr CRAHs were organised in three control groups, each group had its own temperature sensor.
Control strategy simulation could be important when client wants to know how the system behaves in a failure scenario. A failure scenario is when (usually) one of the CRAHs shuts down. In order to avoid racks turning into charcoal cooling performance of the CRAH down has to be compensated for. If a temperature sensor is in the affected area of the hot aisle it will record the locally rising temperature. When receiving this, control system of the data hall can increase cooling performance of the related CRAH group.
In CFD terms to simulate this we first run a simulation with the CRAH down. Temperature of some racks and of the hot aisle locally will increase. In case the client specified the temperature sensor in the right place, my measuring tool in the CFD picks the rising temperature up.
All I have to do is to distribute the missing cooling performance and flow rate among the still operational CRAHs in the affected group and run the simulation again to prove effectiveness of the control strategy.
Same applies to overcooling. If a hot aisle area is getting noticeably colder than target temperature, a well located sensor can pick this up. Cooling performance of the CRAH group that supplies the affected area can be adjusted. A new simulation using decreased cooling performance of the affected CRAH group can again show how effective the control system is. It can also show how well the designer placed temperature sensors.
Different levels of simulation complexity have all their places and times in the design process. Leak or no leak, EnergyStar curve or simple thermal and flow balance are all possible options to implement in a data centre cooling CFD simulation. If a client can tell what they want answers for, there is a matching simulation complexity to give the right answers. Physics and computing power will take care of the rest.
Dr Robert Dul