I am definite that the automotive parts cleaning CFD analysis this application example was written about has been the greatest challenge I have faced so far in my professional life as a CFD engineer. It was about the CFD simulation of the cleaning process of cylinder head castings with high pressure air. What is so challenging in that you may ask? Everithing. Let me describe.
The situation – of course without names and real life data – is the following.
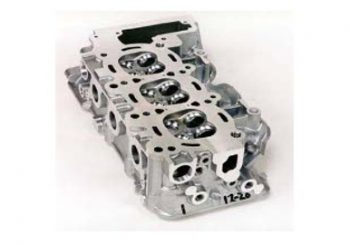
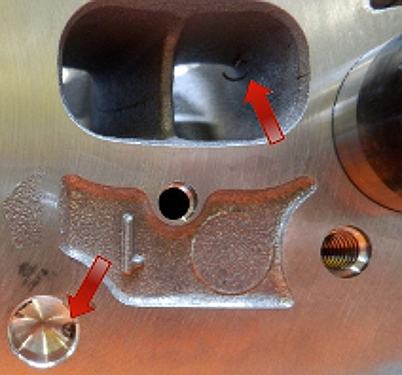
Cylinder head castings go through several manufacturing phases before they meet their engine block and bolted together for several thousand miles. Between phases their dimensions are measured with extremely accurate 3D coordinate measuring machines. These are so sensitive that even a small chip of aluminium from the previous milling step could cause trouble. This is why a cleaning cell is installed before the measuring cell. Its job is to remove small metal pieces stuck into the emulsion covering the cylinder head inside out.
Huge energy consumption for an imperfect work
The point was that this cleaning cell – and a whole lot more of the same type in this huge engine factory – used high pressure air to clean up cylinder heads but some metal pieces always remained on important surfaces. And at the top of all that, this rather small cell consumed alone so much air in a year that cost the same as two brand spanking new Jaguar F-Types. This engine manufacturing factory spends such a big stack of money on compressed air that is visible from 5 miles even in twilight.
By the way, do you know what is the most expensive material in the world? No, not Clive Christian Perfume Imperial Majesty. No, not even the petrol in the UK. It is I believe compressed air. Because you compress it with expensive machinery, treat it, deliver it and then you just splash it.
Anyway something had to be done about the air consumption of this cleaning cell.
So our job was to simulate with CFD the cleaning process of this cell and to reduce its air usage in a way that sliver removing performance remained the same or made better.
Why so challenging
Why was it so challenging? Well, because in this cell were more than 150 pieces of 150 mm long air injectors with a tip bore of 1.25 mm and these air injectors were moving while in operation. In addition to that we had a cylinder head casting that could not be simplified because all of its inner and outer surfaces (cooling channels, gas inlet and outlet channels, valve seats and tons of holes, hundreds of radii) were needed to define real life sliver positions.
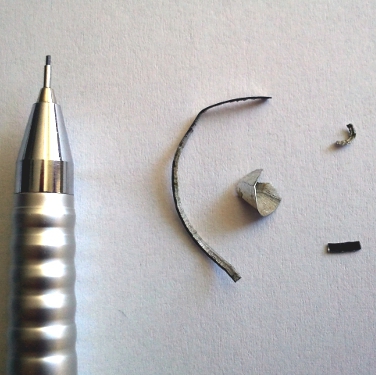
In order to model slivers their size and shape had to be categorised as follows:
| Sliver size and shape | ||
From particle diameter and the density of aluminium SC/Tetra calculated particle mass and inertia supposing the particle was spherical. Since we had other shapes than sphere, particles were described with different drag coefficient where ribbon-like slivers had larger (0,82), sphere-like ones had smaller (0,42). Just for reference, a streamlined body has a drag coefficient of 0,04. This way we calculated so that on a ribbon-like particle larger drag force would arise than on a spherical one both of them having the same mass and thus ribbon shaped ones would be easier to blow away.
Why so inefficient
In its original status this cleaning cell worked in a way that air injectors first moved towards than away from the casting while the air was ON! Just as you can see it in the video below. But in reality instead of one injector there were more than 150 of them. This little example was made for testing motion and particle tracking settings and boundary conditions. Apart from the air injector it did not have any common parts with real life machine.
What can we see here? The green part represents the casting and the 1 mm spherical particles (dark blue points) are sitting in its cavity. The light blue injector and air box is nowhere near the casting but air is already on. I used iso-surface of 20 m/s velocity to represent air flow that is showing up at the injector tip. It is pretty obvious that slivers do not move until the injector is close enough. But when air finally starts doing some cleaning the air injector moves away. I could not get the point of moving air injectors like that, I just couln’t. It is still a mystery why the designer figured it out this way, to me nothing can explain such a setting.
How it can be more effective
So in the second test I used an injector movement setting that looked more reasonable. First air injector started moving in, air was on just a little before the inmost position. While in inmost position air was blowing with full thrust and injector stays there as long as cycle time allowed that. At the end injector moved away nicely and air was shut off.
Please note these were just the first tests of settings. Real life machine is more complex and our proposed solution is much more sophisticated but I am sure you get the point now.
How do you think I knew how long I should keep injectors in the inmost position and air jet switched on? Well – unlike in reality – if you do an automotive parts cleaning CFD analysis you can count the particles leaving the surface of cylinder head. Moreover, you can make a pretty graph of it as a function of time like this:
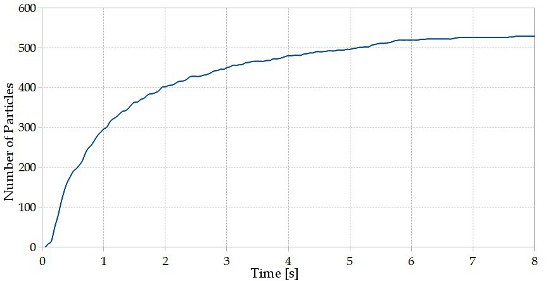
I knew when the curve flattened – at 7 seconds in this case – no more particles crossed the measuring surface so it was not worth keeping air jet on, the injector could move away.
When simulation project results was submitted proposed movement and air injection map were rigorously tested by the client’s manufacturing experts. After several measurements we got the feedback that proposed solution worked just fine. Cleaning performance was not changed compared to the original status but we saved a smaller stack of money by reducing compressed air usage of this cleaning machine.
The story of automotive parts cleaning CFD analysis continues. This case study tells how I built a modular mesh for the next phase of the optimisation process. This case study reveals all the energy savings we have achieved at the largest engine assembly plant in the world.
Dr. Robert Dul