The most challenging bit in every aircraft aero CFD simulation is the proper aircraft geometry. I am sure you have seen fancy CFD simulation results of all sorts of fighter and other aircraft. Believe me, these may only be approximations, nothing more. I know from experience it is extremely difficult get the accurate geometry of a real aircraft. Be it commercial, not to mention military. And if you got the real model, that is for the given job and for that job only. No posts to social media for showing off. But for those of us wanting to experiment with aircraft aero CFD simulation to say test boundary layer mesh settings to be more efficient on a real job, there is a solution. It is called the NASA Common Research Model (CRM).
Common issue due to lack of common models
The aerospace industry has faced the issue of uncoordinated drag and lift predition efforts due to lack of a common geometry for years. In 2010 however John C. Vassberg (technical fellow at Boeing) designed a model that was based on a wide-body airplane fuselage shape somewhere between the 777 and the 787 aircrafts. He also designed a transonic supercritical wing specificly for this model and the CRM [1] was born.
Boeing took the lead on aerodynamic design, NASA took the lead on model design and fabrication and testing. And as such, it is the NASA website from where models and results can be downloaded to start your experiments with the CRM [2].
It is open source but not plug-and-play
I love their initiative of creating a common research ground for aircraft aerodynamic studies. However if you want to start your work based on what you find at the open source, you will need to put in some effort. The magnitude of work depends on your CAD and CFD tools but be prepared. It is not „plug and play”.
Look at the geometry you will find. The version I used is under High-Speed CRM/Geometries/DPW6 Geometries. I picked the DPW_v09_2016_01_28_ParasolidR25 because this was what my CAD tool liked the most. Here is what you get:
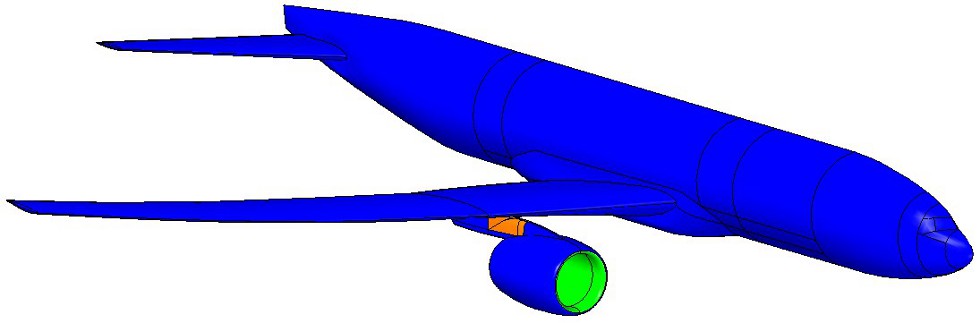
As the CRM was designed to be used in the wind tunnel, it does not come with a vertical tail. You can find one though in the same place as the DPW6 model. The vertical tail did not fit the fuselage perfectly. So I moved its lower surface downwards to increase its overall height while keeping it at its original location.
Making the CRM complete
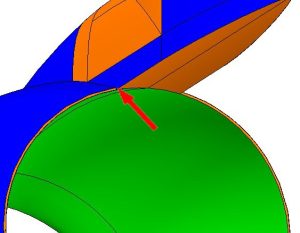
I wanted to have a full size, clean aircraft model so that I can use it later on for other aircraft aero CFD simulation. To get that I had to make the fuselage a closed volume so I created the symmetry surface. When you do the same make sure it is a plane. I made the symmetry surface from the outline of the open fuselage and it needed further adjustments to make it a flat plane. Otherwise after mirroring the two fuselage halves will not match and you will have issues with the mesh. Just like I had.
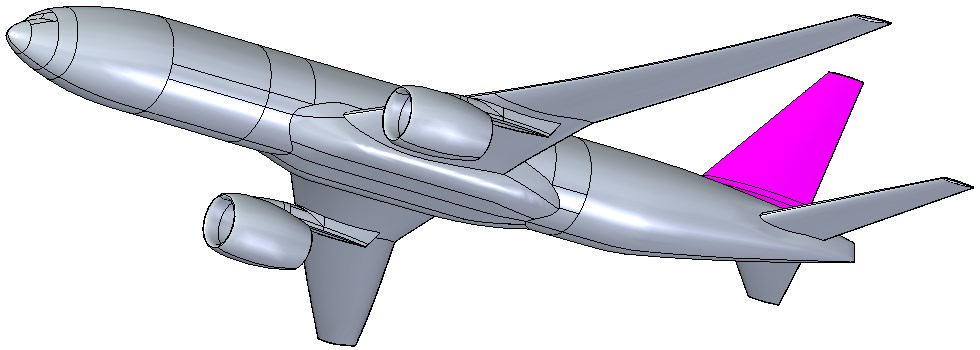
Speaking of size, the DPW6_v09 model needed a 25.4 scale up. I am guessing it was due to parasolid settings as the original CRM model was 22 feet (6.7056m) long. [1] states the span to be 2323.5in (58.7629m) and after scaling up, my geometry was about right with its 58.918m distance between the outmost points of the wing. When all parts were assembled, the full scale CRM looked like this:
It all goes down to Reynolds number
If you want to validate your geometry and other CFD simulation settings, you need to look for some reference results first. Actually there are some defining data in [1] that I could make a good use of. Figures show pressure coefficient (Cp) distribution on the aircraft surfaces. Detailed ones are for the wing-body (WB) configuration (no horizontal and vertical tails, no nacelle and no pylon either). On page 20 is a Cp comparison between WB and wing-body-nacelle-pylon (WBNP) setups. This comparison includes Cp graphs at certain wing span stations which I think are of great value and importance.
Some figures state the flight conditions they are showing results of, some figures don’t. The ones showing Cp map on fuselage don’t tell you the angle of attack (AoA or alpha, or α) for example. The text does say that an airplane like this is designed to fly at Mach 0.85 and at Re=40×106. And these are the two most important numbers you need to work out your CFD simulation settings if you want to compare your aircraft aerodynamic load calculation results with either wind tunnel or other CFD results. The reason why it is so is the similarity criteria.
I work with life-size geometry but wind tunnels obviously cannot use such a big model. They build a scale model and set the wind tunnel conditions to specific Reynolds numbers within their operating envelope for a given Mach number. The best is when you find the exact design point Reynolds number among the wind tunnel data. Remember, in our case these are M=0.85 and Re=40×106 . Your full scale CFD results and their smaller scale wind tunnel results will only be similar if their Mach number and the Reynolds number are the same.
The issue here is that in [1] Table 3. states four wind tunnel operating points none of which match the design point they are showing Cp results for. The fact is [1] does have valuable data from their CFD runs though and the NASA CRM website also contains CFD results of their own. Under High-Speed CRM/Computational Approach/Computational Results/ you will find Cp and coordinate data for a series of AoA. But these are all for M=0.85 and Re=5×10⁶ . And they did not use the nacelle/pylon setup. However this does not match my geometry configuration, this one actually does match the yellow one of the wind tunnel points in [1].
Pressure coefficient comparison on the wing
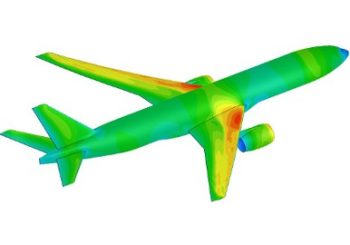
If you find a reference with close match of both key data (Mach and Reynolds numbers), visual comparison will give you an initial idea of whether what you have done looks about right or not. The figure below shows Cp on aircraft surfaces in WBNP configuration from [1] and my results for the full geometry (WBNP+vertical tail).
![Vassberg [1] Cp on upper wing surfaces, M=0.85, Re=40x10<sup>6</sup> , AoA=2°](https://www.cfdengineering.co.uk/wp-content/uploads/2022/01/4_vassberg_WBNP_Cp_1.jpg)
supposedly M=0.85, Re=40×106, AoA=2°
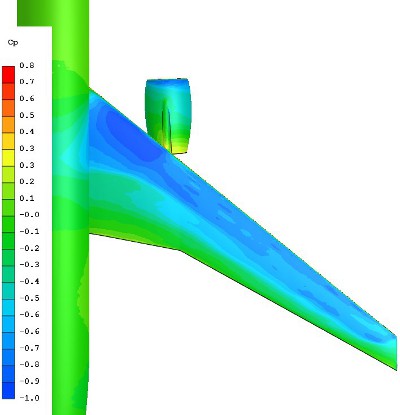
definitely M=0.85, Re=43×106 , AoA=2°
My results were run slighly off this design point: M=0.85, Re=43×106 instead of M=0.85, Re=40×106 . As far as results of [1] on the left are concerned these could be the closest ones to mine as unfortunately they did not state neither Reynolds nor Mach numbers for the figure.
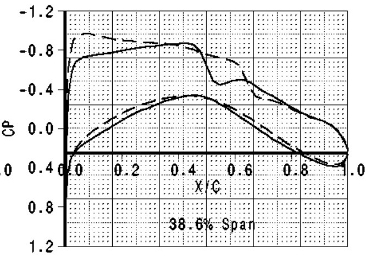
They did state the operating point numbers for the wing span Cp data though. So I trusted these more than visually comparing Cp fields on wing surfaces. [1] did not disclose the AoA but previous Cp graphs presented AoA=2°, so I assumed these used the same. I chose two span locations (38.6% and 72%) to compare [1] with my M=0.85, Re=43×106 results.
![Vassberg [1] (blue) vs CFD Eng UK (red), Cp results at 38.6% span](https://www.cfdengineering.co.uk/wp-content/uploads/2022/01/9_vassberg_vs_cfd_38p6span_cp_1.jpg)
Cp results at 38.6% span
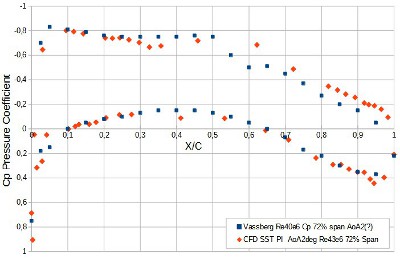
Cp results at 72% span
Comparison of Cp data shows I was probably right when supposing AoA=2° for the [1] reference data. Agreement on the leading edge and on the lower wing plane are looking good. My CFD results (in red) are a bit higher on the upper plane towards the trailing edge. But this could be due to the difference in Reynolds numbers, as mine is 3×10⁶ higher. Or it could be a geometry issue, like in the louvre case study.
Aerodynamic load comparison on wing and fuselage
I was interested in comparing not only the wing pressures but also wanted to know how the fuselage performs. As [1] had no numeric results like that I ran a CFD simulation at the point of M=0.85, Re=5×10⁶ at AoA=2° as NASA provided computational results samples for a range of AoA at this low Reynolds number. NASA’s samples are not using the pylon, nacelle and vertical tail. Again, not a complete match of geometries but you can’t have everything. Below figure shows an overview of my Cp results on the fuselage.
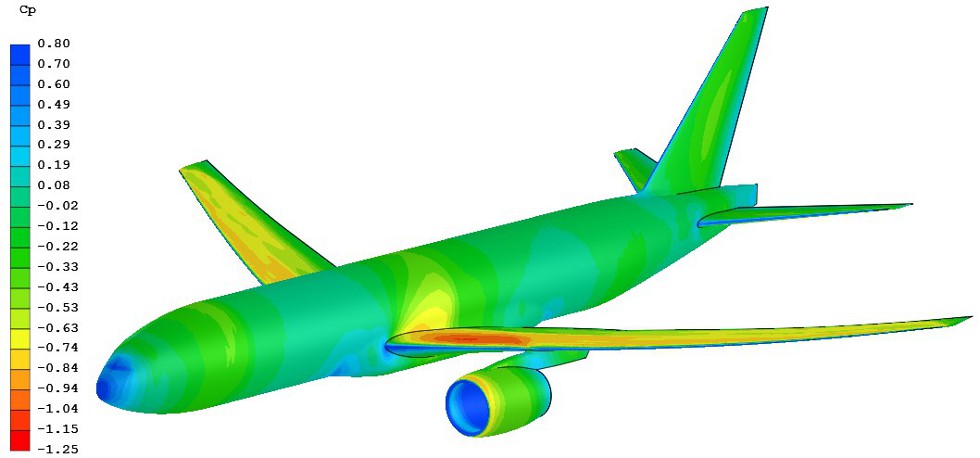
M=0.85, Re=5×10⁶ , AoA=2°
Centre line pressure coefficient data are the following in comparison with the NASA samples. Continuous lines are for the upper, dotted ones are for the lower centre line. Green shows the NASA samples, red shows the CFD Eng UK results.
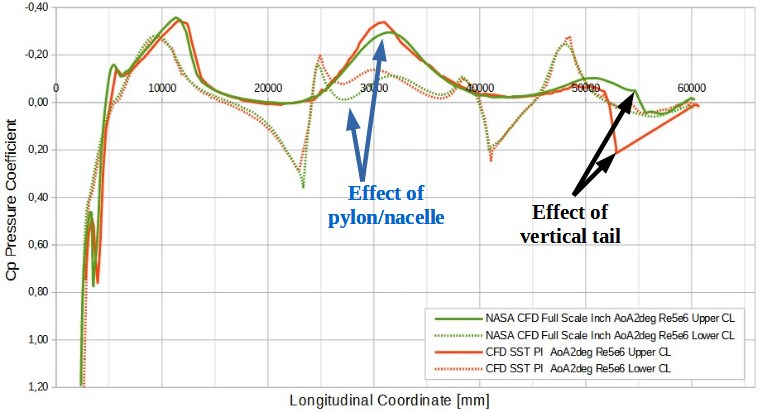
M=0.85, Re=5×10⁶ , AoA=2°
It is a pretty good fit for both lower and upper portions. The differences are all because of the different geometry. Blue arrows show the difference due to the pylon/nacelle in my version. The black arrows point out the difference due to my model having a vertical tail.
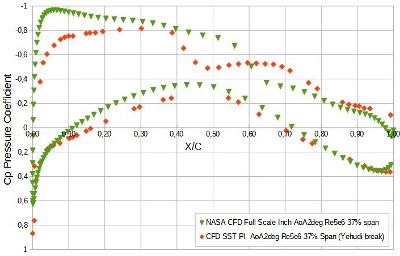
Cp coefficient comparison at the usual wing span locations gives good feedback too. At 37% wing span station, the difference between my results and NASA CFD samples are very close to what Vassberg in [1] presented when assessing the effect of pylon/nacelle geometries.
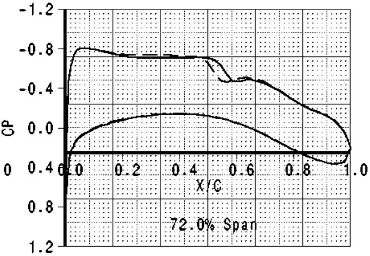
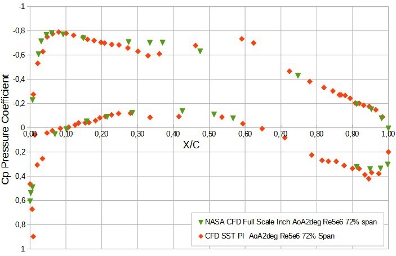
At 72% wing span where pylon/nacelle has smaller effect NASA’s CFD and my results are in good agreement. Especially at leading and trailing edges and on the lower wing surface. Vassberg [1] gives his results for the same span station which show very similar difference for geometries with and without nacelle/pylon.
All the above tells I now have a life size wide body aeroplane geometry. I also have the CFD settings to accurately simulate design points determined by Mach and Reynolds number pairs. The next step is clear. Fancy external attachments to the fuselage to carry out aircraft delta drag modelling, somebody?
Dr Robert Dul
[1] Vassberg et al.: Development of a Common Research Model for Applied CFD Validation Studies; Session: APA-19: AIAA CFD Drag Prediction Workshop Updates; Published Online:14 Jun 2012 [2] https://commonresearchmodel.larc.nasa.gov/