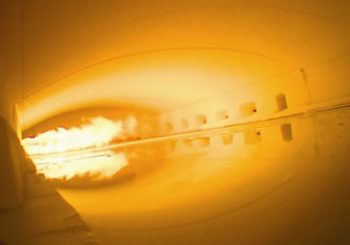
During the past 12 years of offering CFD engineering services I had the chance to look into several different types of furnaces. But the most impressive and most terrifying certainly was the sight of a glass melting furnace. We carried out this furnace wall erosion CFD analysis to determine factors that influence degradation of the refractory in contact with molten glass. Looking into the furnace while 10m long flames were roaring above the pool of molten glass I thought hell could look just like that.
I do not know what kind of refractory materials are used in hell. Not sure how durable these are either but here furnace wall materials wear and tear during the years of use. From time to time, depending on the type of furnace these have to be replaced.
New furnace wall in every 13 years
Refractory of a glass melting furnace must be completely replaced in every 13-15 years. Actually this is a giant leap compared to the 1-2 years of service life a century ago. Despite much longer life wear of the furnace wall still needs continuous watch and provides regular work for professionals maintaining the furnace.
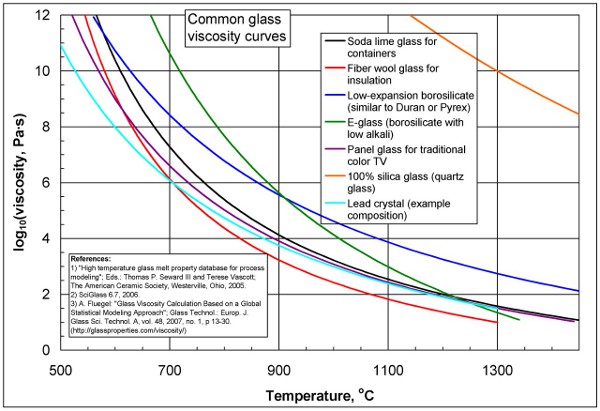
Heat resistant material of furnace wears down because of the flowing, highly viscous and hot glass. Temperature of glass in the furnace is around 1400°C. At this temperature its dynamic viscosity is 100 Pa.s. This value is 100 times the viscosity of water at room temperature and 10 times the viscosity of honey. In ten years molten glass erodes the wall as rivers erode mountains in thousand and million years. Since wall is in continuous contact with hot flowing glass, it is vital for furnace maintenance people to know what makes the furnace wall erode faster or slower.
Glass melting furnaces are designed for 13-15 years of usage. To build a furnace like this takes an enormous investment. And if for any reasons service life is reduced to 10-12 years that means loosing a pile of money.
It is important to know how operating parameters like temperature of melting flame, flow rate of earth gas for each burner affect flow patterns of molten glass. Flow patterns directly determine erosion the furnace wall has to take.
Like making jam, but much bigger and much warmer
Have you ever cooked jam at home in a large saucepan? If yes you have already seen a very similar flow pattern to that in a glass melting furnace. In the middle of the saucepan a hot zone is formed (where the centre of the cooker plate is). In this zone the hot jam flows up towards the surface. On the surface it flows to the walls and at the walls it turns down to the bottom. At the bottom it flows towards the hot zone in the middle again. A very similar circular flow pattern is formed in a glass melting furnace. However the difference is that on one side batches of sand mixture (raw material of glass) are added to the melt and on the opposite side molten glass flows out of the furnace.
Have you ever cooked jam at home in a large saucepan? If yes you have already seen a very similar flow pattern to that in a glass melting furnace. In the middle of the saucepan a hot zone is formed (where the centre of the cooker plate is) in which the hot jam flows up towards the surface. On the surface it flows to the walls and at the walls it turns down to the bottom. At the bottom it flows towards the hot zone again. A very similar circular flow pattern is formed in a glass melting furnace with the difference that on one side batches of sand mixture (raw material of glass) are added to the melt and on the opposite side molten glass flows out of the furnace.
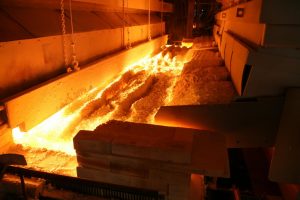
Source: usglassmag.com
In a furnace like this 1000 tonnes of molten glass flows very-very slowly, erosion is slow too, so testing operating parameters is complicated. On the other hand by using computational fluid dynamics simulations we could work out a model that was able to model wall erosion in an accelerated way.
A unique way to quantify wall erosion
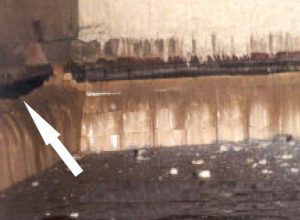
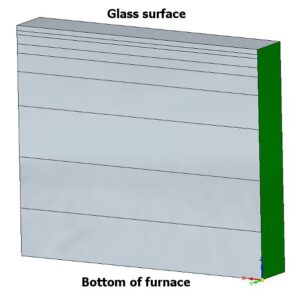
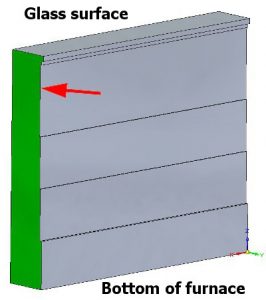
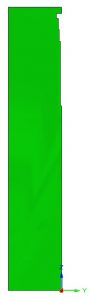
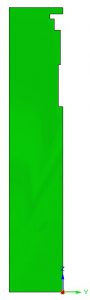
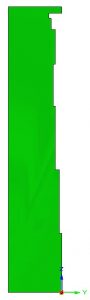
One important part of the method was the way measuring surfaces were formed on walls in contact with molten glass. We knew from references that the majority of erosion can be expected where glass surface is in contact with the wall. The shape of eroded wall can be seen on the left picture. At this level height of measuring surfaces are much smaller, there are lot more of them here than closer to furnace bottom. This resolution containing 8 measuring surfaces along the height of the wall can be seen on the right.
We decided so that components of wall forces would be measured. Our CFD software tool called SC/Tetra can measure wall friction velocity and wall shear stress too. These are also suitable for quantifying erosion. Wall friction velocity was used to simulate vacuum cleaning of cylinder head castings to quantify cleaning performance of air flow.
Furnace wall was divided into sections not only along its height but also along its length. Length of a segment was 1.5m and more than 20 segments added up the whole length of the furnace. As a result we had more than 200 surfaces to measure wall forces on.
Series of CFD simulations, first with new walls
The actual operating parameters were supplied by the glass manufacturing company. Using these we made the first simulation of glass flow with a new, nice and flat furnace wall. SC/Tetra wrote all three components of wall forces into a text file. Three force components times 200 measuring surfaces gave us 600 force values to work out the amount of material eroded from the new wall.
600 values were immediately reduced to 400. Because the y-direction force components (perpendicular to the wall) were neglectable compared to x and z-directions. X-direction was parallel with longitudinal axis of the furnace. Z-direction was the height of wall being positive from the bottom to glass surface. The picture on the right shows. If wall force x-component was negative on a measuring surface, it meant that glass flowed in the direction towards the downstream-end of furnace (where glass was taken from it).
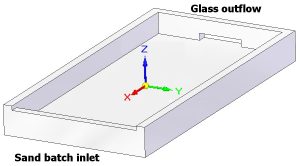
In case z-component was negative, this meant a downward flow going from glass surface to furnace bottom.
Odd looking wall force distribution
Pictures below show graphs of these two force components (Newton values projected to a unit surface thus these are in N/m2 like pressure) for all of the 8 measuring surfaces of 1.5m long wall segments between segments 8-24. Projection to a unit surface was necessary because area of measuring surfaces were very much different. These were narrow at glass surface, wide at furnace bottom.
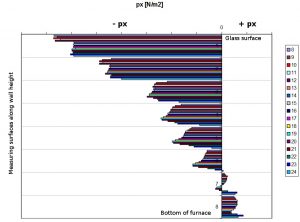
So on the horizontal axis we show sign and magnitude of wall force. On the vertical axis location of measuring surfaces along wall height can be seen. On the vertical axis they are in the same order from bottom to top as they are on the wall in the simulation model. Nr.8 measuring surfaces are the closest ones to the bottom, Nr.1 surfaces are the closest ones to glass surface.
These pictures are expressive because they show that on the left px picture largest forces are the ones closest to glass surface. This is the place where largest erosion can be expected. This corresponded with data found in references and with experience of furnace maintenance personnel.
An even more interesting fact that only in a part of the height of molten glass bath glass flows from batch intake side to glass removal side of the furnace. This is because px is negative. Then closer to furnace bottom do glass flow just the opposite direction? Because px is positive? Is it possible?
Sure but I did not know that at that time. Let me get back to this later.
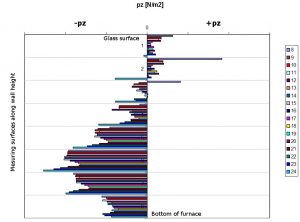
Let’s see the vertical pz force component. What we can see here is that at the measuring surfaces close to the bottom, glass flows from top to bottom (negative pz). While closer to glass surface glass flows from bottom to top (positive pz).
We calculated forces for a new wall, we had a quite complex flow pattern that changes along the length and wall height of the furnace. How could we derive erosion out of it?
How to speed up a process that takes 13 years in real-life
I mentioned before that total degradation of a new furnace wall happens in 13-15 years. It really is a slow process. This slow process can only be modelled with a sequence of simulations if we assign the maximum erosion to maximum wall forces in a given simulation, to speed this slow process up.
Let’s suppose that we assign 25mm of eroded wall thickness as a maximum after we have wall forces for a simulation with new, flat furnace wall. This 25mm must be proportionately divided between maximum px and maximum pz. Let 20mm eroded wall thickness belong to maximum px, and 5mm to maximum pz. This way if maximum px and maximum pz is measured on the same surface, largest eroded wall thickness would be 25mm. All other measuring surfaces would produce eroded wall thickness less than 25mm.
Excel helps calculate wall erosion
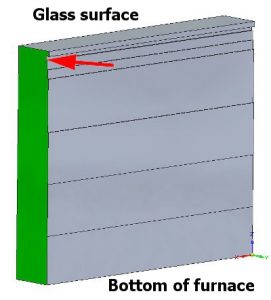
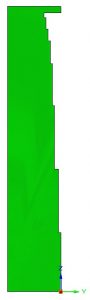
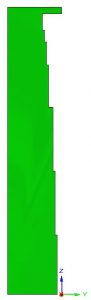
By using an Excel worksheet it is easy to determine fractions of maximum eroded wall thickness as a function of wall forces on that given measuring surface. These fractional eroded wall thicknesses then can be modelled in the CAD system by reducing the original wall thickness. If original, new wall thickness was 200mm. At a given measuring surface the new wall thickness will be 180mm if erosion was 20mm in the first simulation run. Pictures below show two 1.5m long wall segments, each having a different eroded shape. Red arrows point at the location of the largest erosion (from where the biggest wall thickness is missing after the first simulation run).
Closer to batches of sand input the two force components (px and pz) resulted in an erosion profile which has the largest missing wall thickness at half the wall height. This erosion shape is caused by the flow patterns of freshly melting batches of sand. Closer to the glass output end of the furnace we face a different erosion profile. Because the largest eroded wall thickness can be found at the surface of molten glass.
Erosion profile becoming visible
After a new simulation with the same boundary conditions but with eroded wall as furnace geometry is completed, depending on the changes of maximum wall force values, new maximum of eroded wall thickness can be determined and proportionally assigned to measuring surfaces. This way it becomes visible how the erosion process goes on with each simulated step of wall shape change. Erosion can go faster, slower or can stay unchanged for a given measuring surface, depending on the flow pattern of glass. These tendencies can clearly be shown on the CAD model of the eroded wall throughout the simulation sequence.
One of the greatest victories of my career
Getting back to the big question whether it is possible that a reverse flow direction close to furnace bottom could exist, compared to the main flow direction near the surface. The answer arrived from the best possible person after presenting results of the furnace wall erosion CFD analysis in the glass factory. The chief engineer showed a picture, on which the eroded wall of the previous furnace was presented.
A furnace which had the same dimensions and same operating parameters we simulated. It was one of the defining moments as to why I offer CFD engineering services and keep on doing this. Because all could see marks of reverse flowing glass at the bottom third height of the wall in the rear part of the furnace. Success was sweet. I begged for that picture but the chief engineer refused to hand it out because of secrecy reasons.
I can tell you anyway that I learnt a lot about how a glass melting furnace works. And also successfully found a method to speed-up and model wall erosion. Now that this article is published I hope I will not receive inquiries from hell as to how this method could be used for their equipment. I am not sure of the consequences if I rejected them. Luckily this simulation method works not only for furnaces but for other devices where the task is to speed-up and analyse a slow erosion process.
Dr Robert Dul