In 2012 we received an interesting fluid flow and heat transfer simulation job. A silencer had to be installed on a carbon-dioxide exhaust point of a huge chemical factory. Within this project our job was to carry out a CO2 diffusion CFD analysis in the atmosphere of the ammonia works. A chemical factory CFD analysis is complex by its own right but as a bonus how can the area of a whole production facility be modelled?
Obviously we had to simplify since the smallest area to look at in terms of CO2 concentration was 515 by 565 metres. This part of the factory is packed with storage tanks, pumps and other devices necessary for the technology. There are large areas where you cannot see the sky because of the immense number of pipelines above your head.
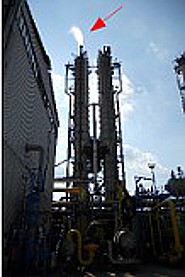
Release point high above ground
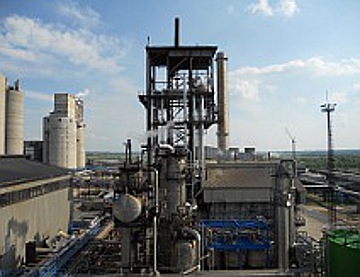
The CO2 exhaust point in question is on top of a splitter coloumn 56 metres above ground level. On the left picture below a red arrow is pointing to the outlet. You can also see the steam that comes mixed with the CO2. No, I did not climb that high up. For me it was enough to take a look around at half way and shoot some photos of the surrounding area.
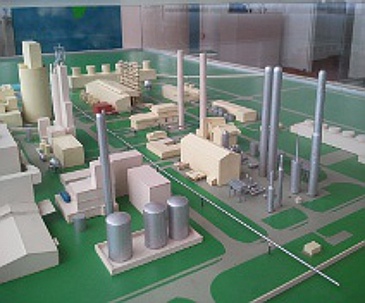
Mix of traditional and modern modelling techniques
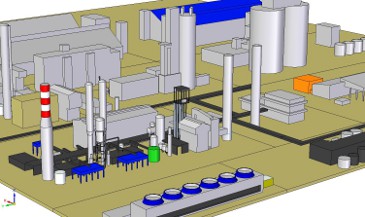
Well, to create a simulation model of that size I used both traditional and modern technologies. Many years ago a scale-model was made of the whole 2nd factory covering the place where my CO2 outlet was. This model was still on show so I could take some photos. On the modern side there was the mighty Google Earth that even contained satellite views dated back to 2003. With its capability of measuring distances it was quite handy to get an idea of building sizes.
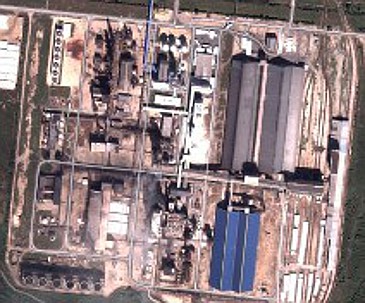
In order to check scale and positioning of CAD model I used Google Earth too. In a photo editor I copied the screen-shot of CAD as a half transparent layer onto the screen-shot of Google Earth. When I saw some misalignment I fine-tuned CAD as long as the two pictures matched properly.
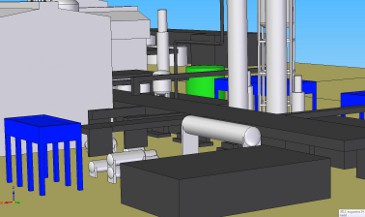
CAD is very detailed in the neighborhood of CO2 outlet since here is the highest risk of CO2 reaching ground level in case of adverse weather conditions.
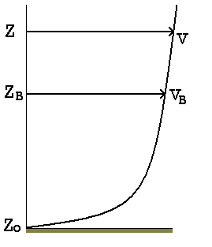
Wind speed as a function of height
Among boundary conditions – apart from describing mass flow and temperature of carbon-dioxide (CO2 left the outlet with a speed of 61 m/s and its temperature was 60°C) – I had to set wind direction and speed. The latter one as a function of height. Defining wind direction was pretty easy because on this part of the country wind always blows from northeast according to the weather station of the factory.
We can approximate dependency of wind speed on height from ground level with a power-law function:
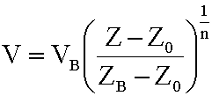
where
Zb: height of wind speed sampling,
Vb: measured wind speed,
n: constant that stands for the a roughness category representing the surrounding area outside the simulation domain. For example large flat ground like sea has n=10, urban area with high-rise buildings close to each other has n=2.8571. [1]
Within this CO2 diffusion CFD analysis project we took several weather conditions taken into account. Winter and summer, dead calm or normal wind speed were used to calculate carbon-dioxide concentration. Besides wind we had some other factors to take into account. There were two huge heat exchangers by the side of the splitter coloumns from which a fairly large volume flow of 40°C air was rising and this could have an effect on CO2 diffusion at certain weather conditions.
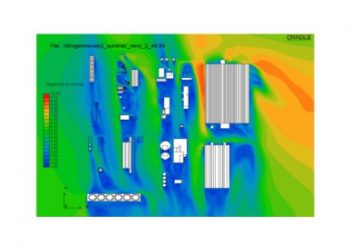
Results of different concentrations in the air
On the pictures below you can check out the results of CO2 diffusion CFD analysis in summer at normal wind speed. On the left you can see the 0.5% CO2 concentration. This concentration is harmful for human life. On the right is the 0.1% concentration plume above the ammonia factory. This figure shows the north-northeast view of the ammonia plant. I coloured buildings and other obstacles with static pressure that wind generated on solid surfaces.
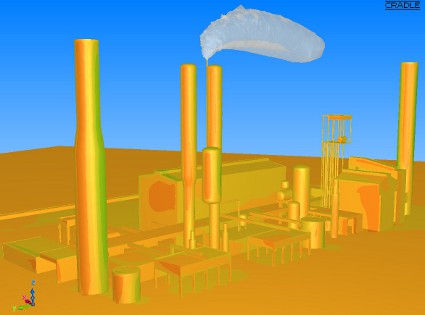
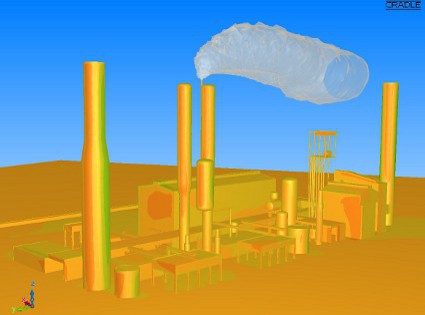
From these results we could clearly see that 0.5% concentration is well above the plant. With weather conditions like that there is no risk of having high CO2 concentration close to ground levels. Please note that CO2 concentration reduces to harmless 0.1% above the ammonia plant. So there was nothing to worry about further away from the factory.
We can extract a lot of interesting information from simulating gas or liquid diffusion. We apply the same method as the above described for air pollution simulation in cities. I also used these features for modeling leaking earth gas in case of high pressure gas pipes.
Dr. Robert Dul
[1] Architectural Institute of Japan: “Guidebook for Practical Applications of CFD to Pedestrian Wind Environment around Buildings”: p.158.